


Data-source integration & modeling
Connect authorized warehouse and operational data, establishing useful relationships and agreed business definitions.
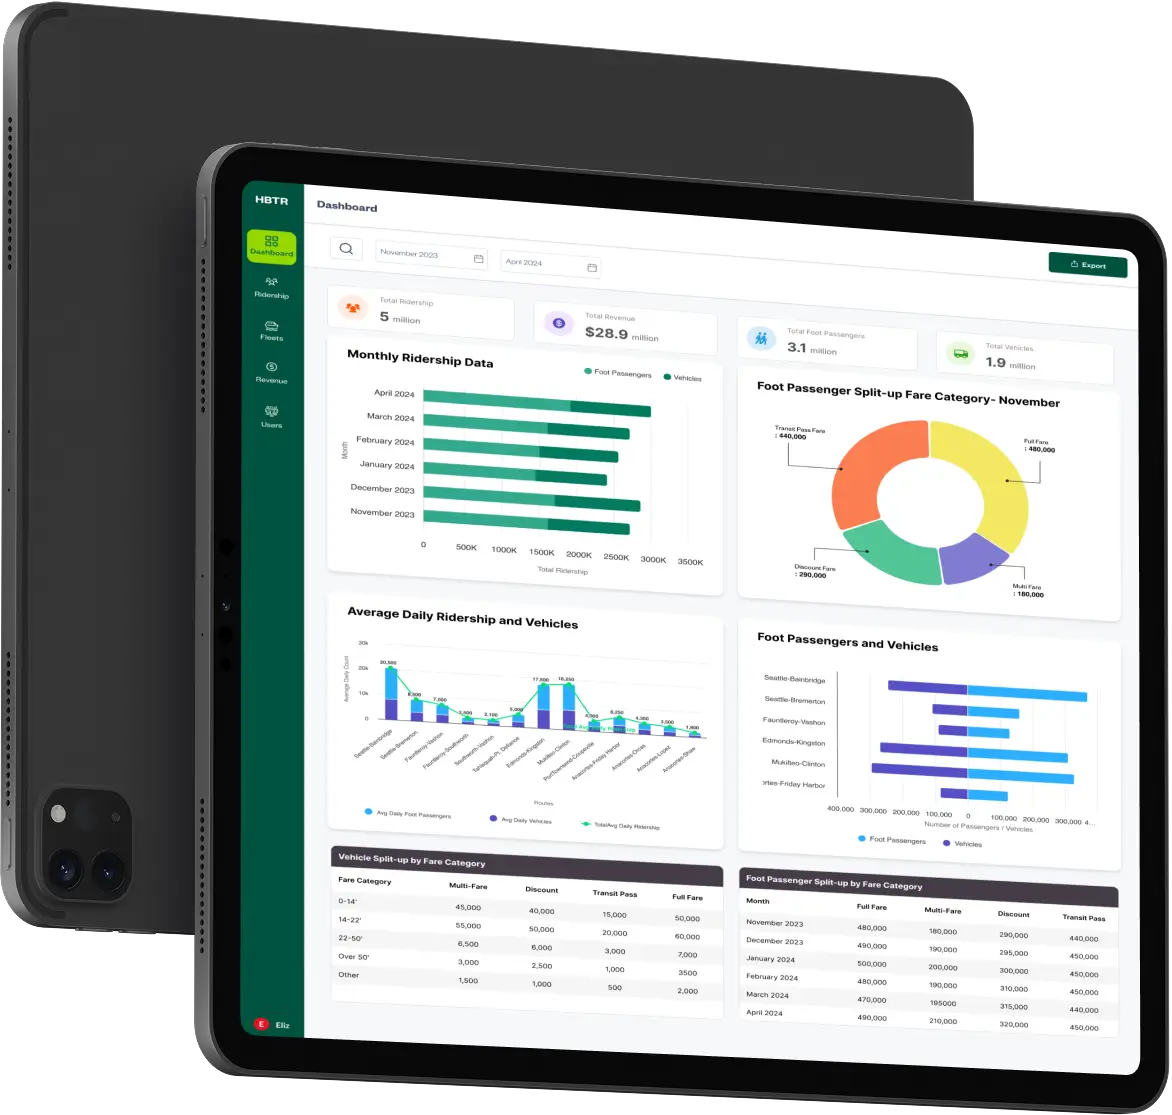
Connect authorized warehouse and operational data, establishing useful relationships and agreed business definitions.
Build interactive views with appropriate charts, cards, tables and cross-filtering around the decisions users need to make.
Present available fare and business measures with clear definitions, time periods and drill-down context.
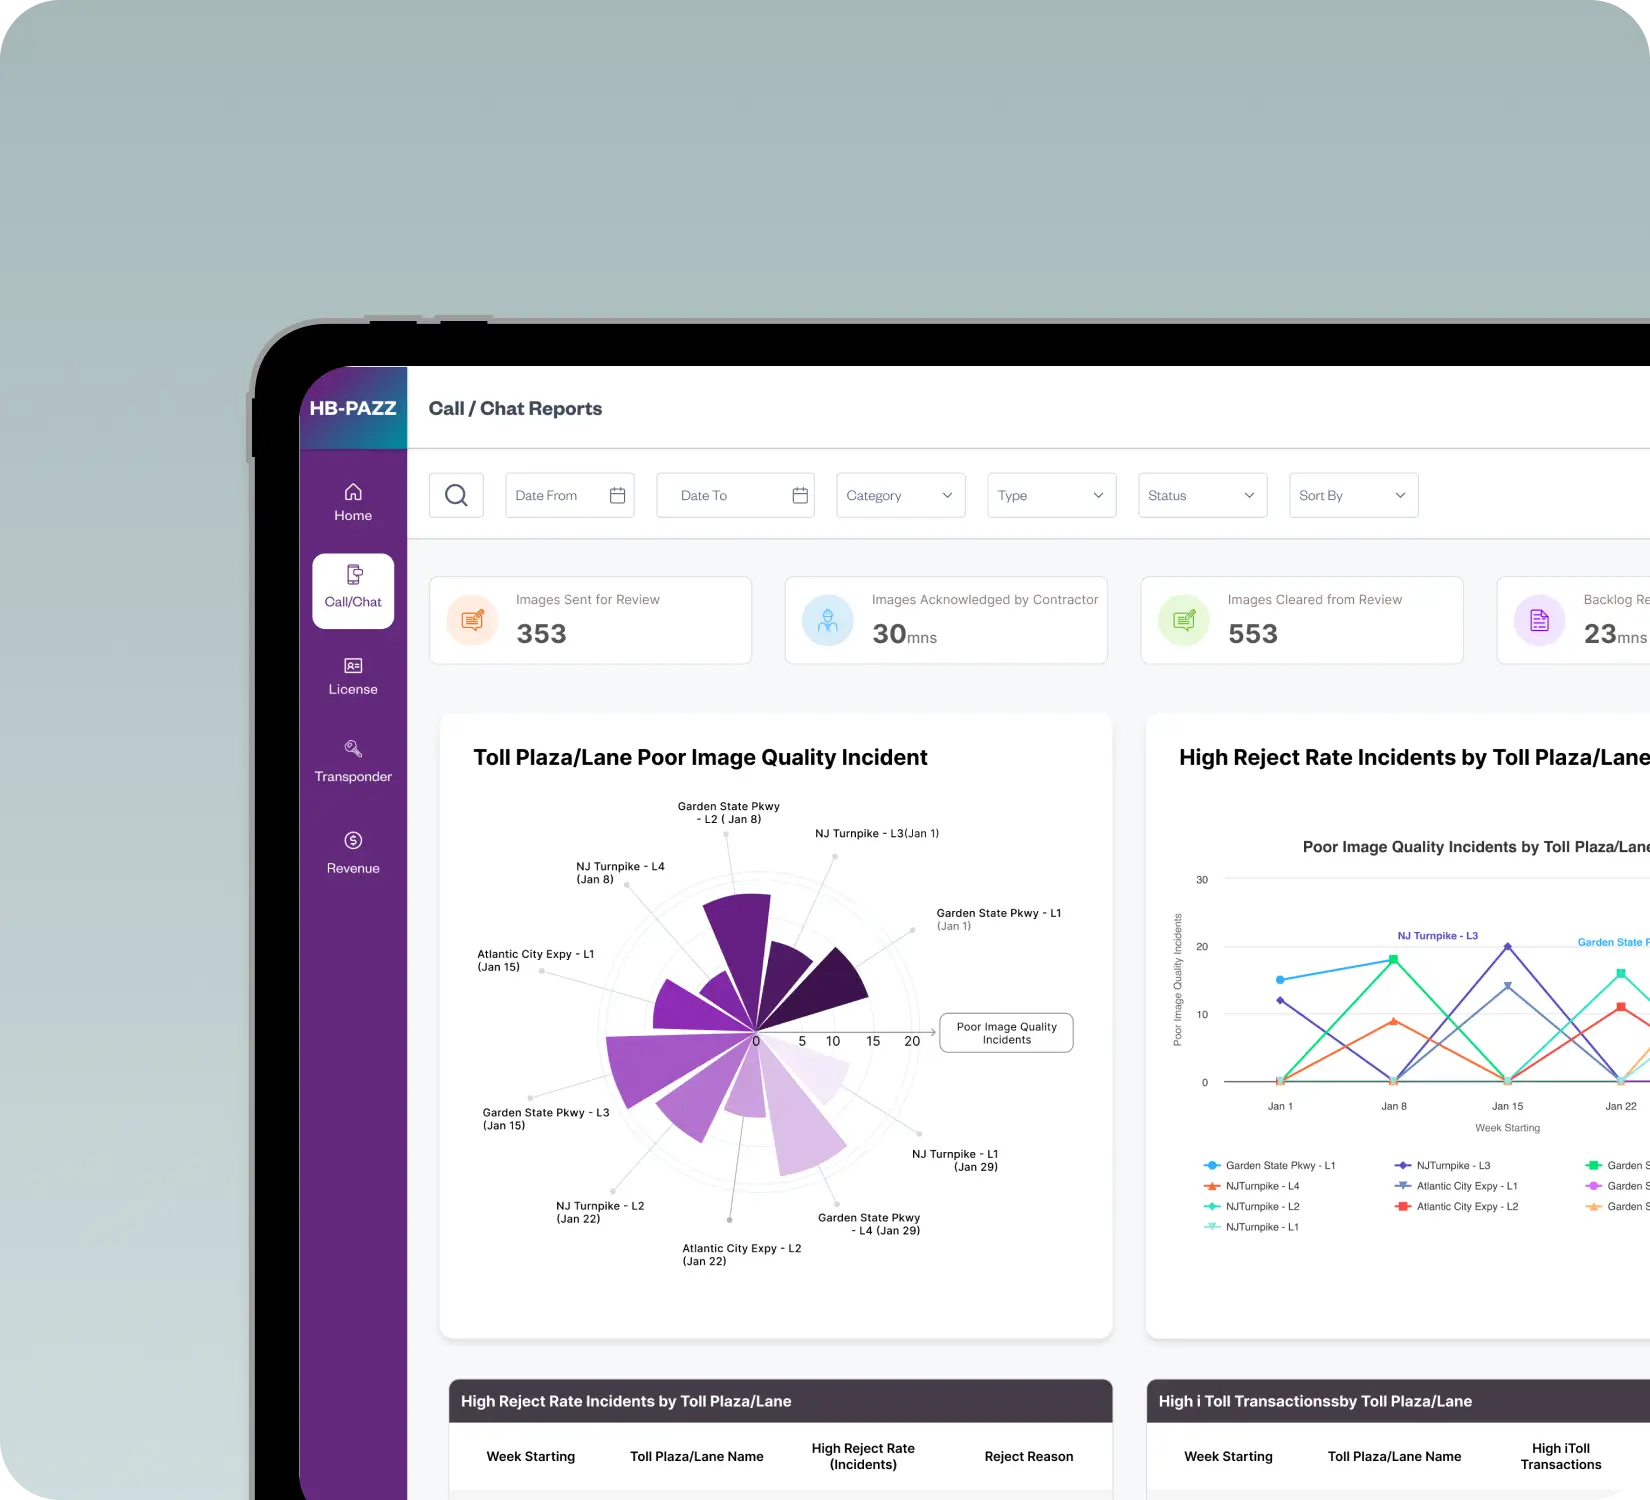
Visualize reported availability, performance and exception information alongside the relevant operational context.
Use supported map views and filters to compare locations, agencies, periods or service categories.
Scope reporting interfaces, exports and distribution around user needs and the capabilities of the selected reporting platform.
Align authentication and data visibility with permissions, including row-level restrictions where appropriate.
Define source access, refresh behavior and checks that help distinguish stale or incomplete data from an operational change.
Compare calculated measures with agreed source records and resolve discrepancies with the teams responsible for the data.
Development Experience
Our development experience includes the MARTA reporting app, alongside reports and dashboards for other metropolitan transit programs. We bring that foundation to reporting requirements, data integration and stakeholder review.
The focus is on clear reporting definitions, understandable operational context and information that stakeholders can review.
Discuss our design approachHow we approach your program
Agree calculation rules, refresh expectations and ownership. Audit existing reports and reconstruct missing definitions.
Specialists direct agents across data preparation, report components and test cases. Stakeholders review working outputs in Agile iterations.
Compare calculations with agreed source records, check access controls and investigate discrepancies before acceptance.
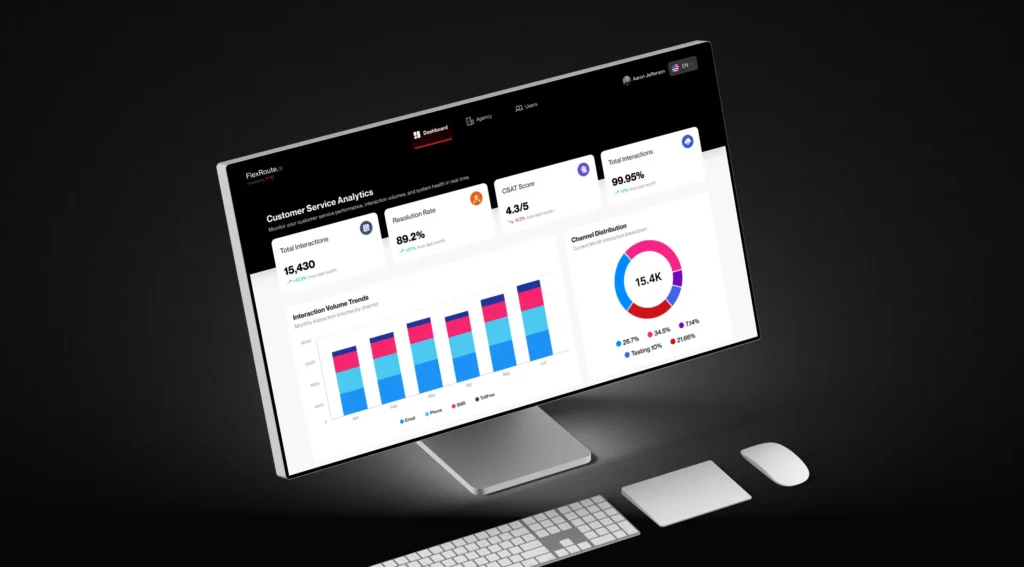
FlexRoute.AI bridges multi-platform systems into a secure, multi-tenant contact center operations and analytics hub, standardizing performance tracking and automating compliance.
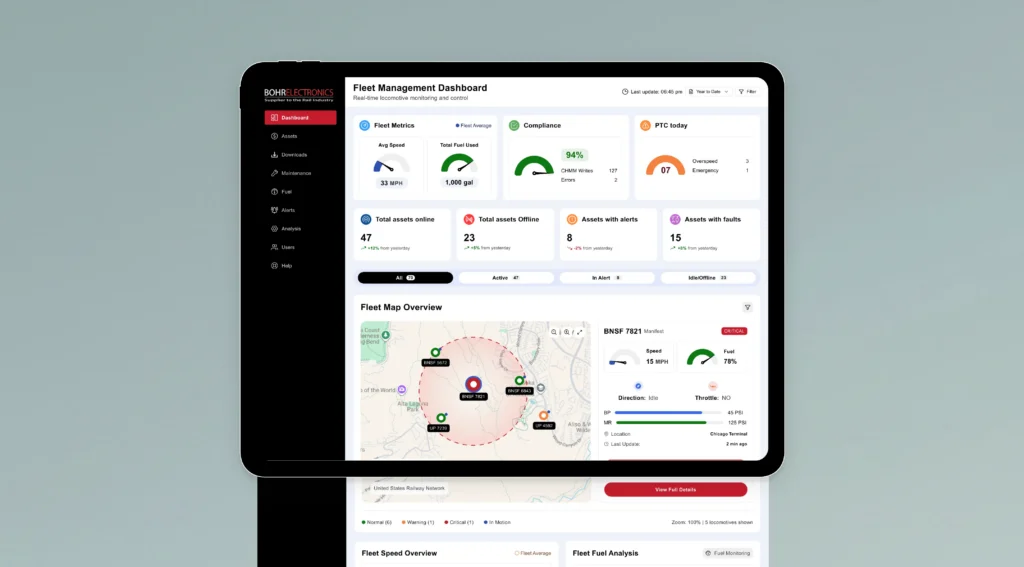
Bohr RailConnect is a cloud-native SaaS telematics platform built with HubSpire to ingest real-time locomotive IoT sensor data, optimizing fuel efficiency and maintenance for railway operators.
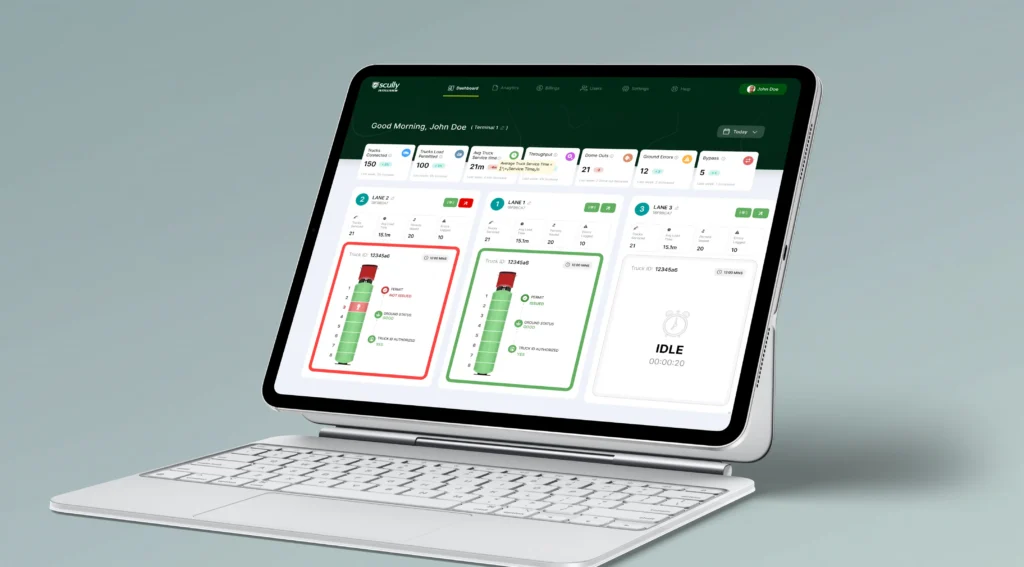
IntelliView 4.0 is a cloud-based SaaS platform providing terminal operators with real-time lane monitoring and intelligent analytics to optimize loading efficiency and minimize operational downtime.
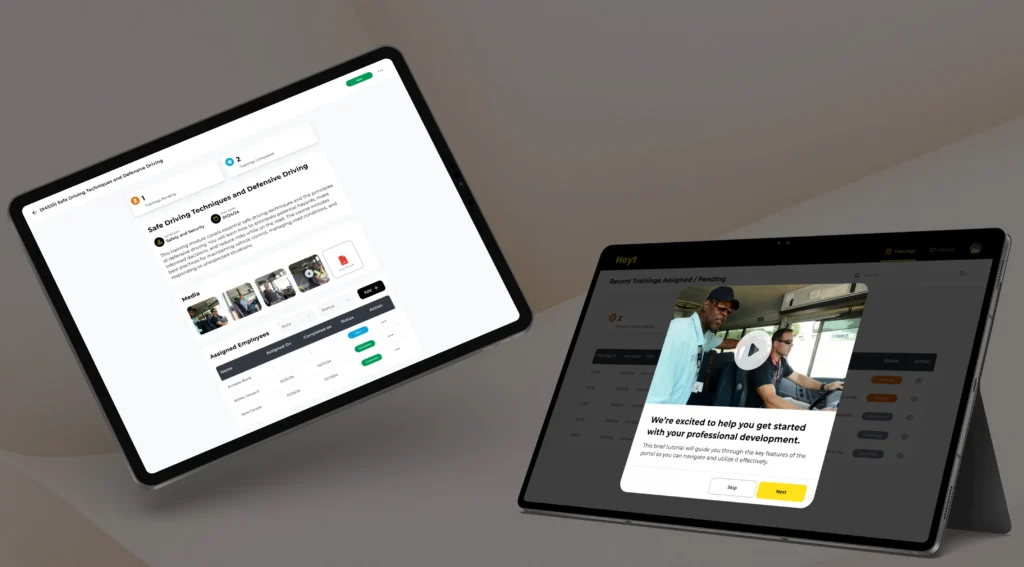
A unified digital ecosystem with dedicated Admin and Employee portals that centralizes workforce operations, compliance training, route distribution, employee engagement, and recruitment.

PTLS is a digital logistics platform that connects shippers, dispatchers, trucking companies, drivers, and pilot vehicles through automated bidding, job management, payment processing, and real-time tracking.


